Full Case Study
Product Design
2025
Los Angeles Solar
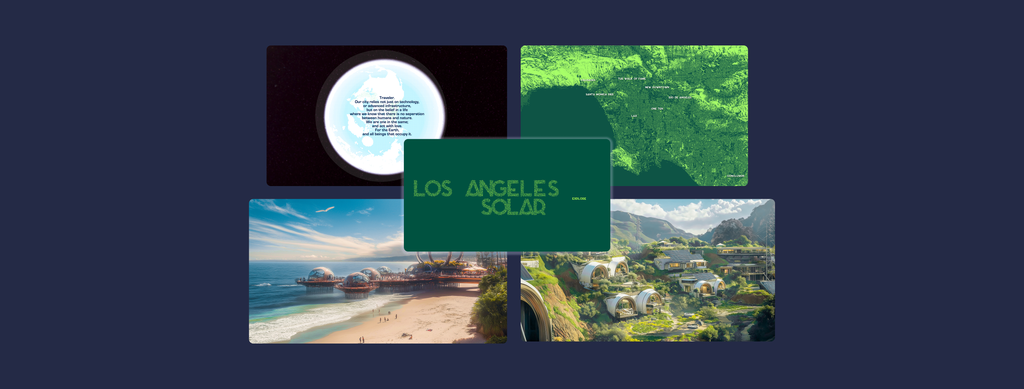
Los Angeles Solar is an immersive storytelling website where you can explore several locations in LA transformed into a climate-positive future.
This project was displayed in NYU Shanghai’s 2025 IMA Capstone exhibit and experienced by 50+ live attendees.
Explore the project here. Best viewed on desktop.
Thesis & Capstone Project
Roles
Designer
Developer
Tools
Figma, HTML/CSS/p5.js/three.js, Procreate, Midjourney, ComfyUI, Adobe Suite
Timeline
February – May 2025
Problem
Popular media is filled with apocalyptic future visions that feed into the climate doomsday narrative. Climate change is a problem of unprecedented scale, and we need hope to spur action.
Yet, how can people have hope when there is so little examples of positive climate futures?
How can people move towards a future that they cannot imagine?
*Read the full thesis paper here. Research conducted Fall of 2024.
Description
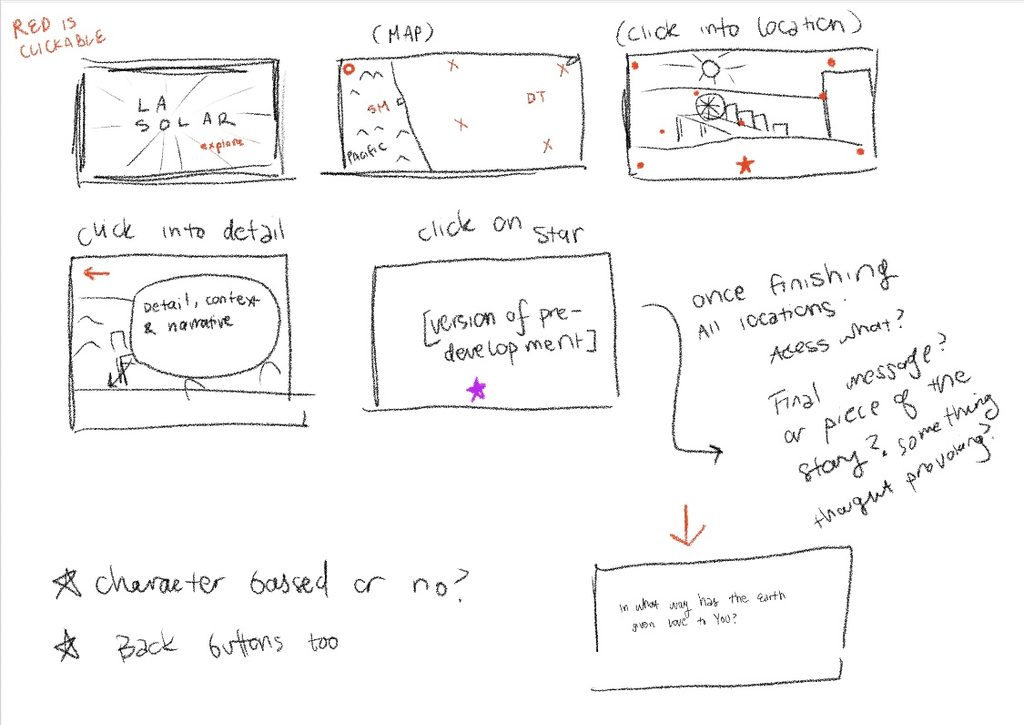
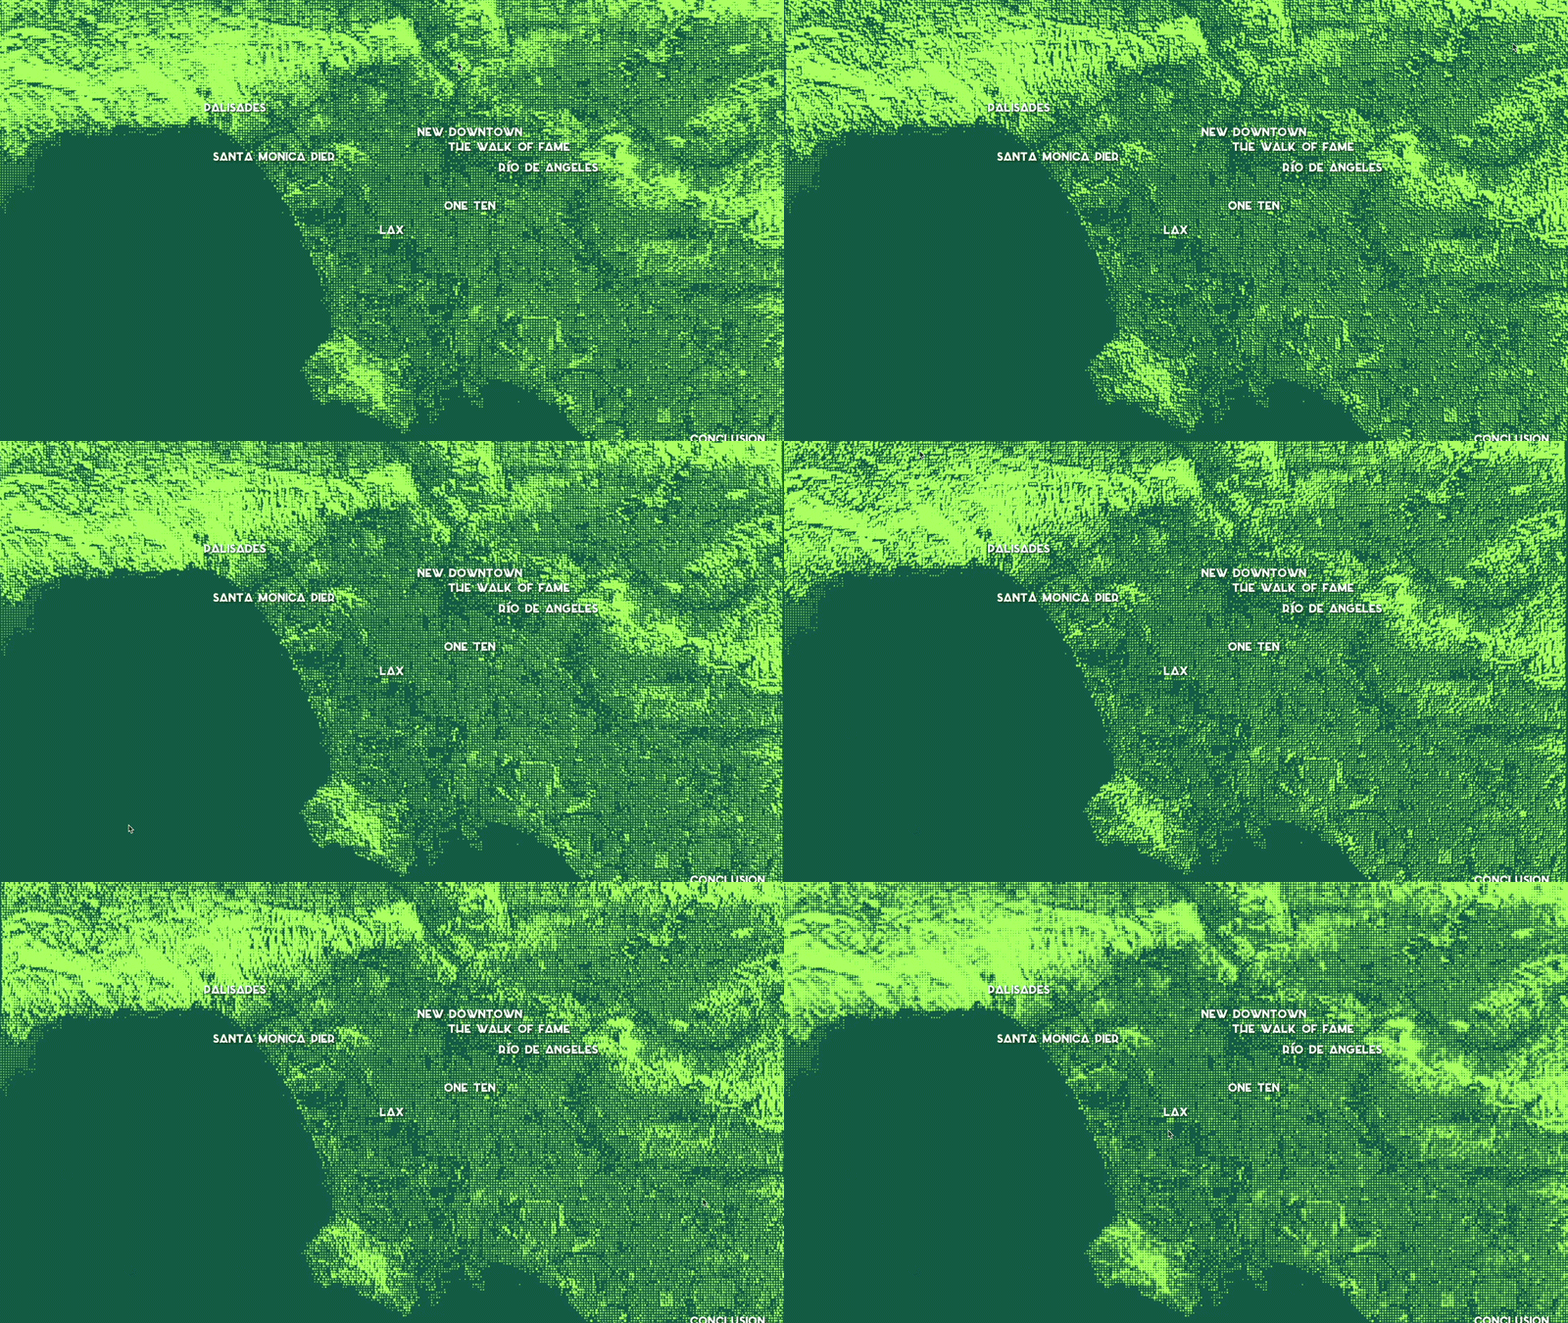
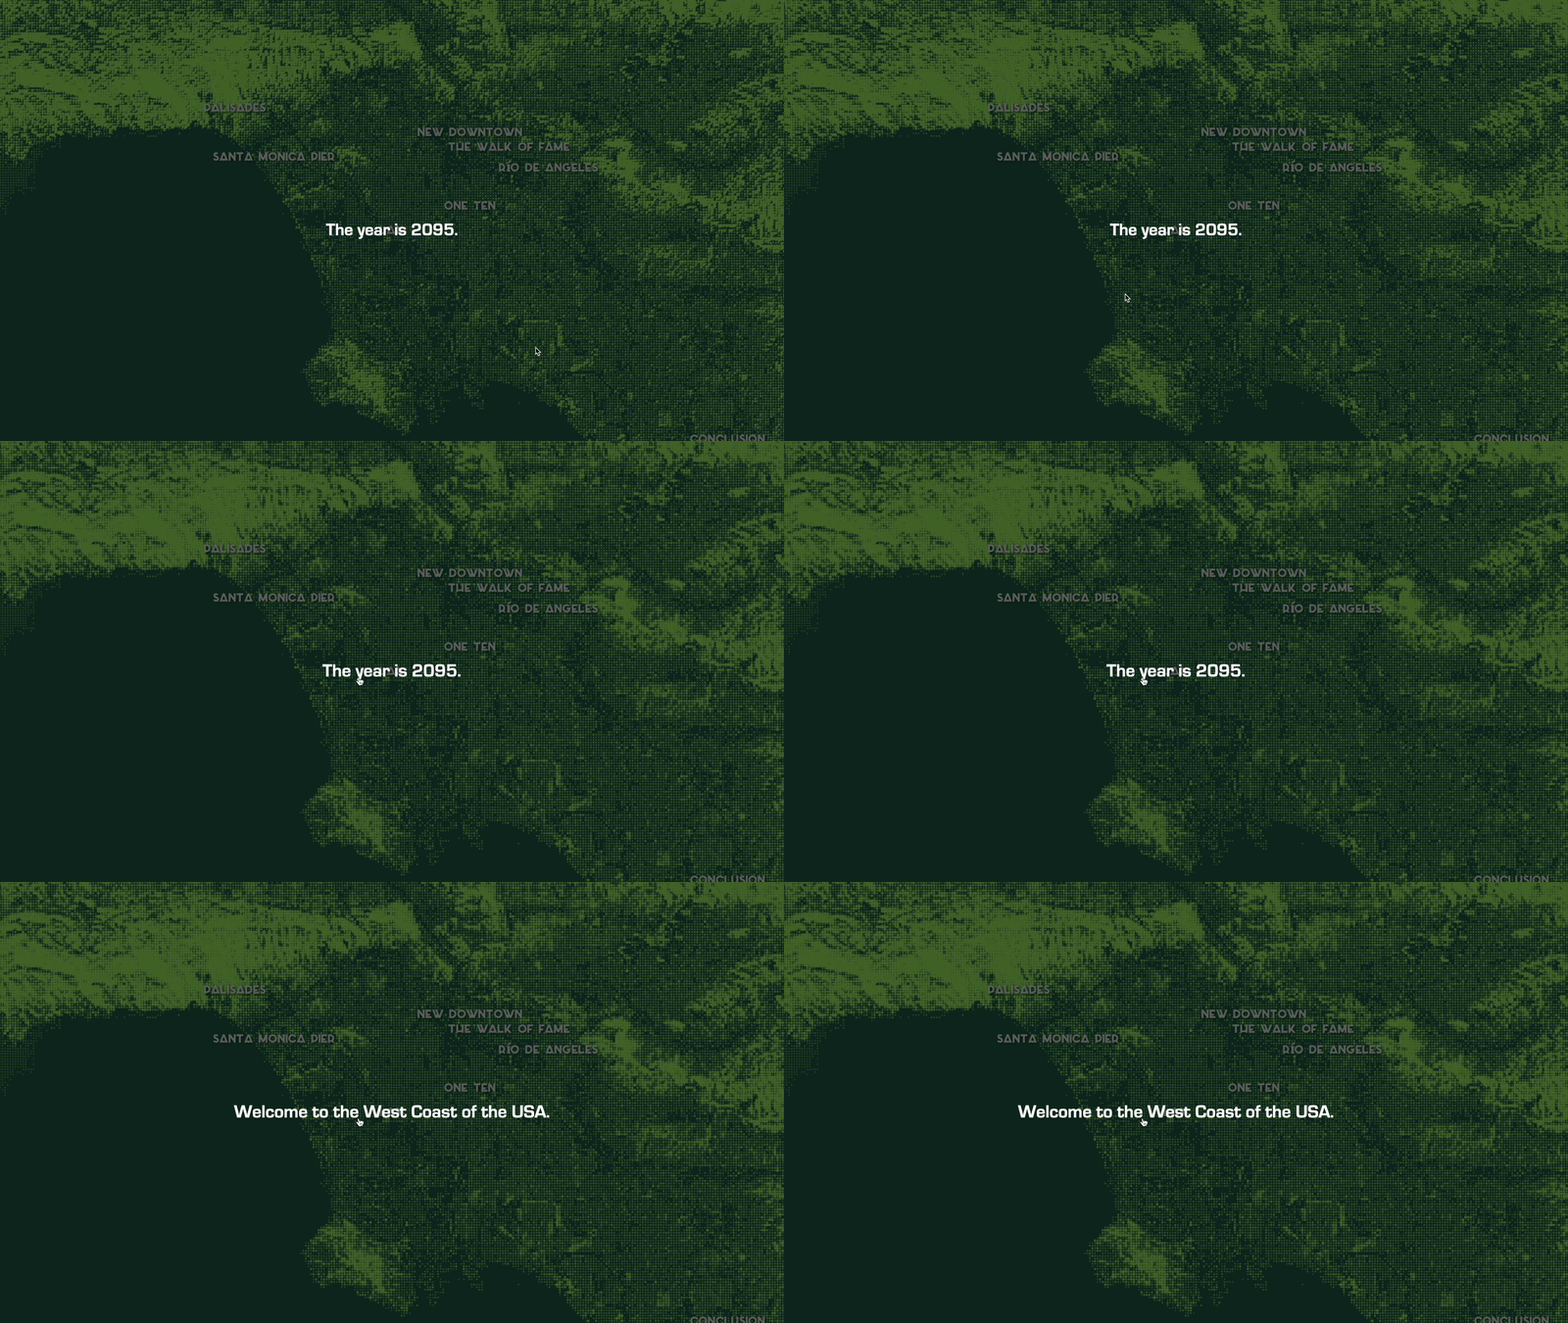
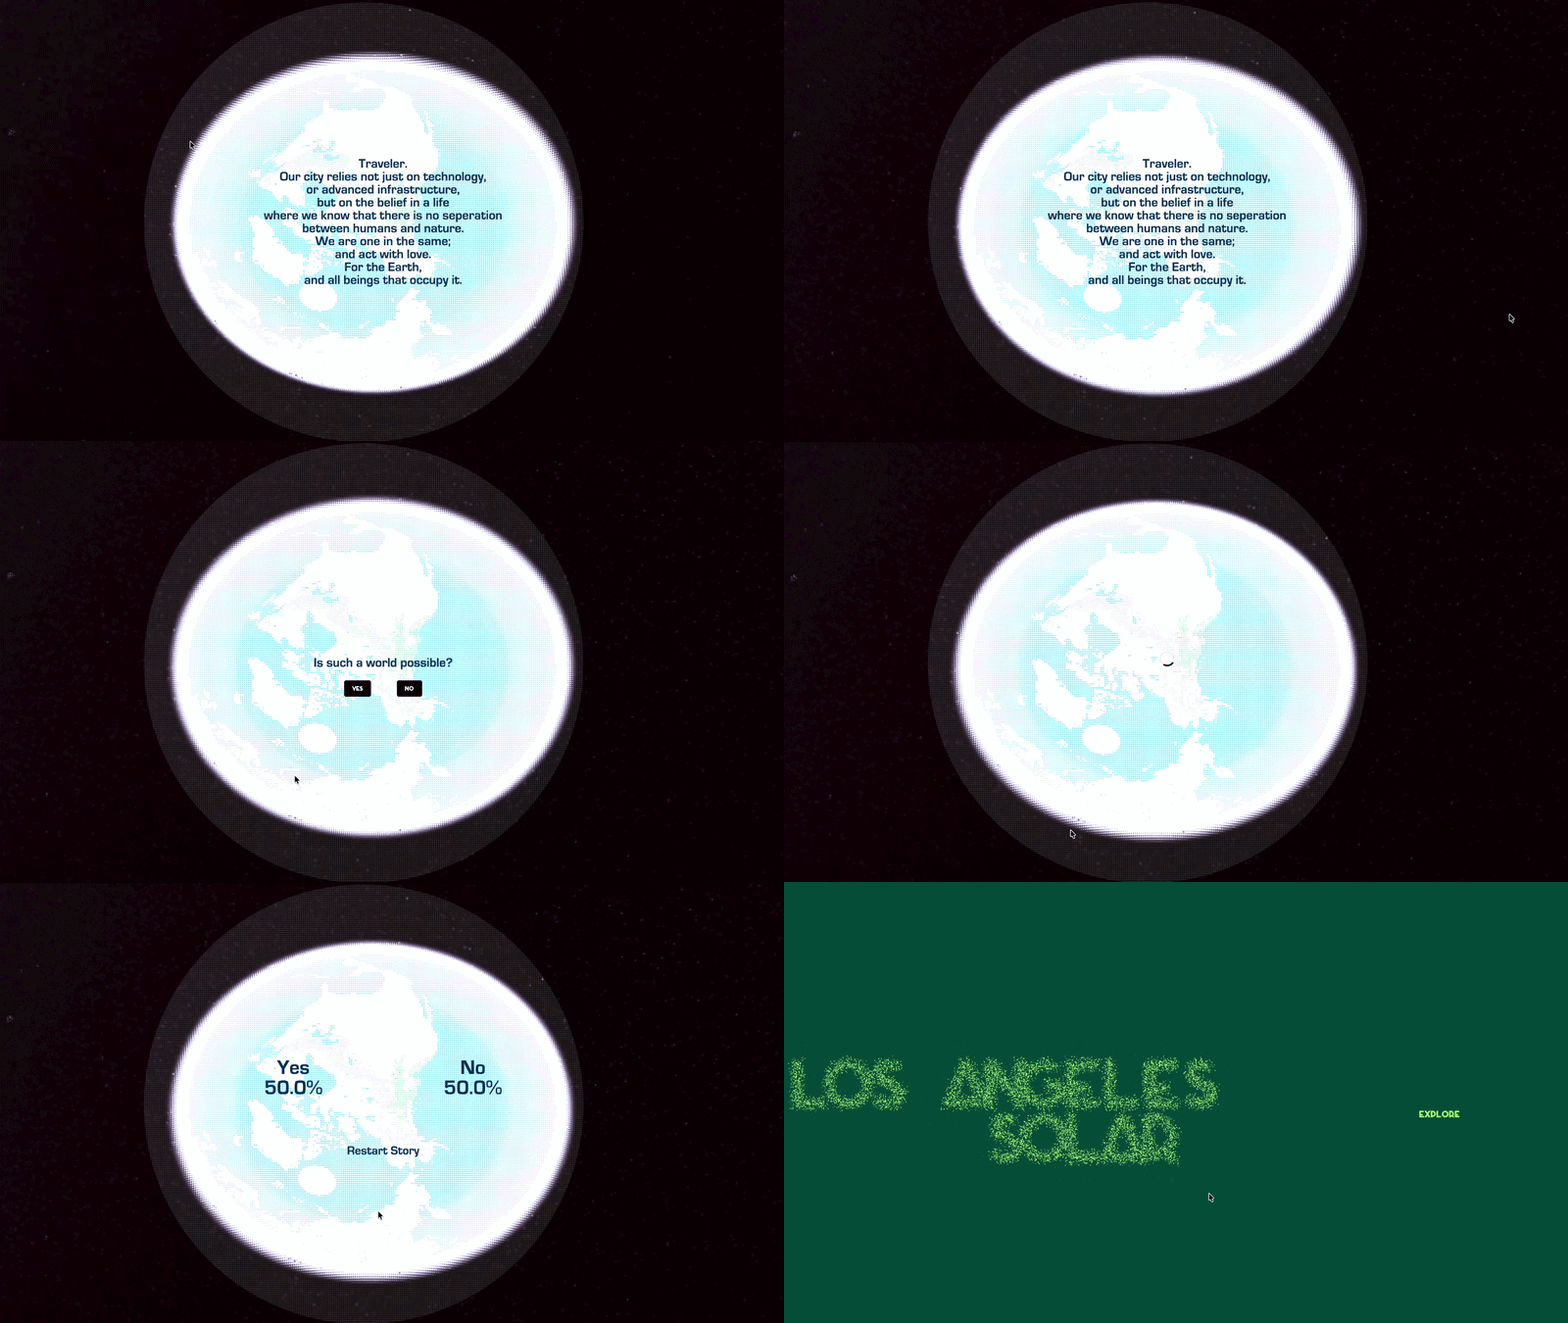
Users can experience a click through narrative telling the story of a solarpunk* future of LA. The main interaction is a map; users can navigate through 7 different iconic locations and explore their transformed future. After exploring, there is an ending narrative to the story, and users are left with a poll question (“Is such a world possible? Yes/No”) before being able to restart the experience.
*Solarpunk is a philosophy & aesthetic imagining sustainable futures built through community and green technology. Could be considered the antithesis of cyberpunk.
Process
To create a grounded yet inspiring story, I thought about what concepts I needed to build upon first, and how I could allow users the most agency while still intuitively guiding them through the story.
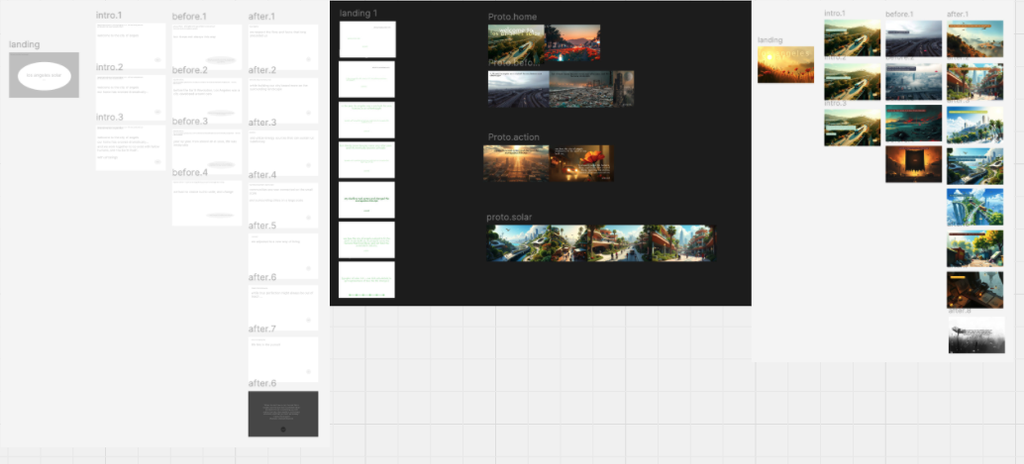
First, I had to test the best format for the site.
I explored several options, and had a loose format:
★ Character centered narrative
★ Educationally focused site
★ Scrollytelling experience
★ First person map-based narrative
★ 10 participants
★ Qualitative impressions + time
spent interacting with several Figma
prototypes & existing references
The results culminated in the general feedback that the map-based narrative created the most initiative and personal engagement with users. The other formats gave a more boring impression, and the available interactions were too “passive”.
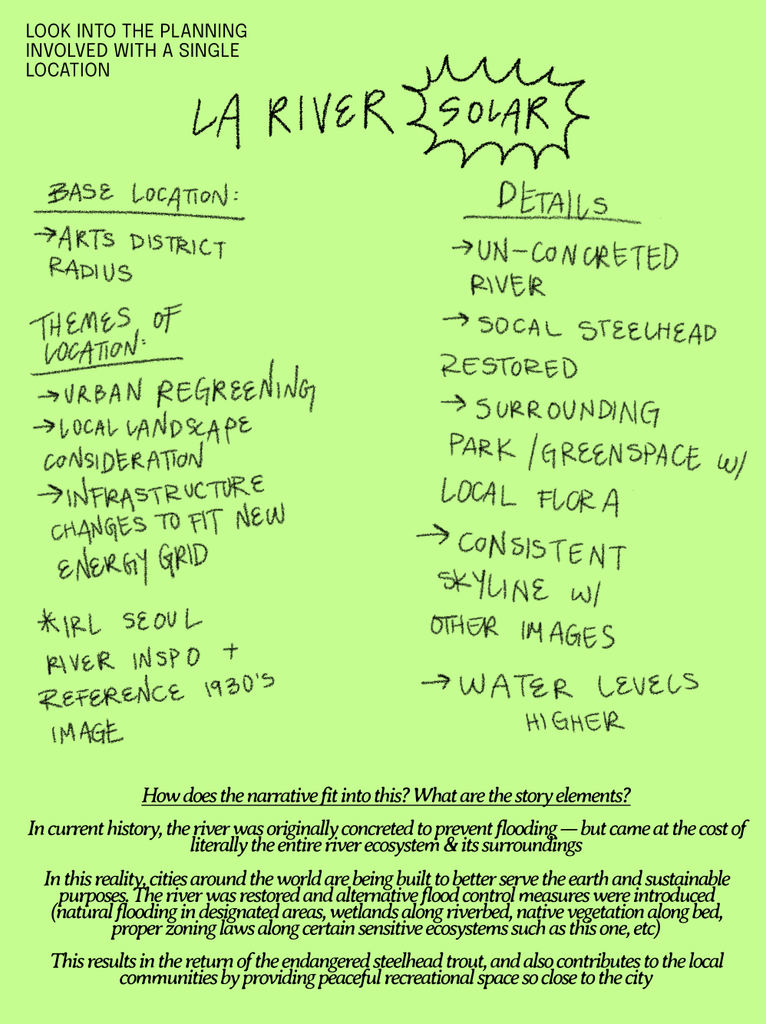
So, I decided to start on the ground in my home city of Los Angeles.
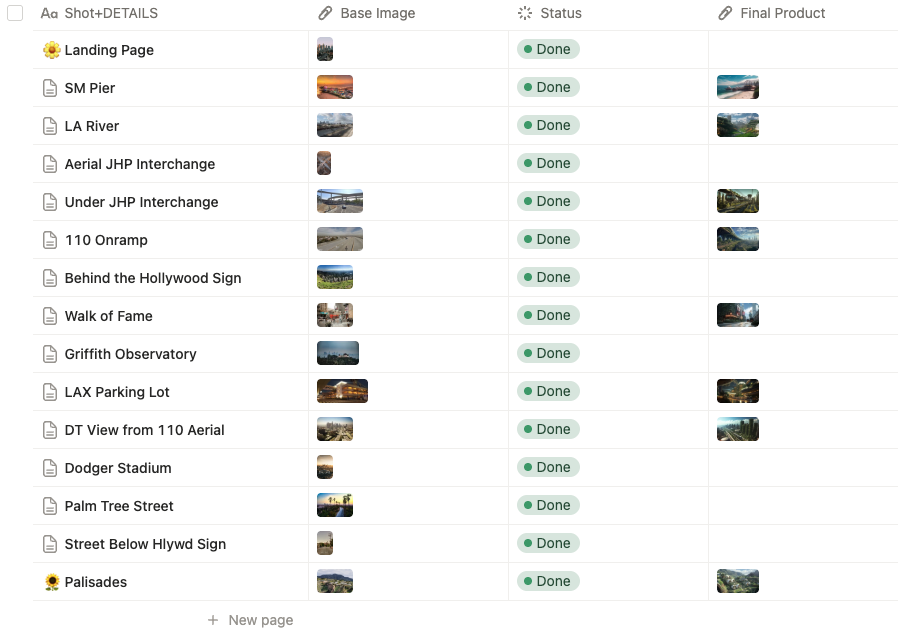
After developing and exploring 14 possible locations, I narrowed it down to 7 well known places.
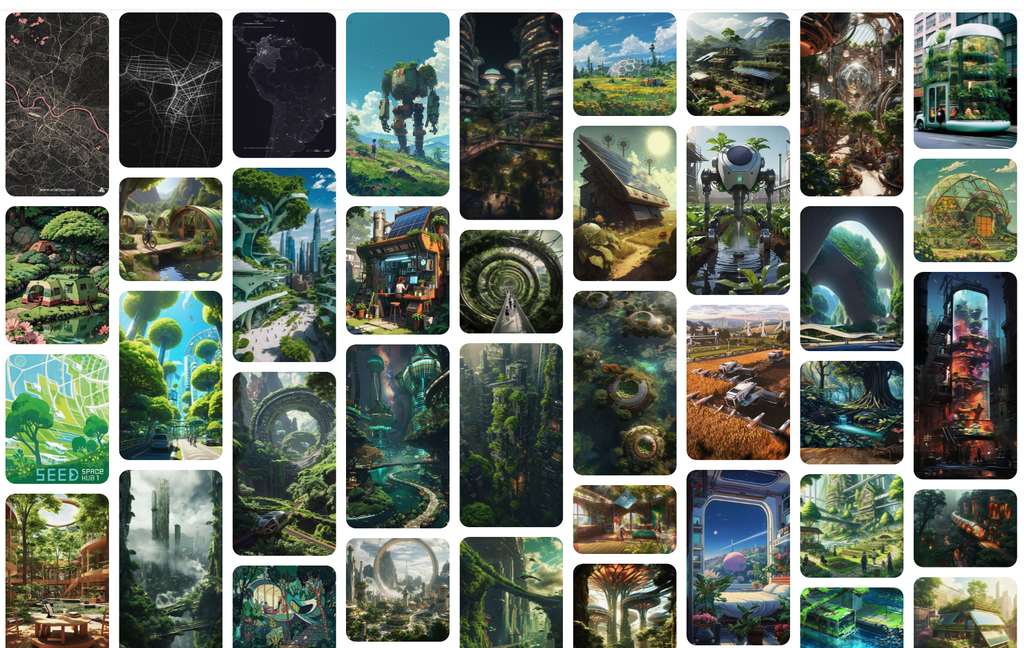
I also decided to use an almost-photorealistic digital art style when showing each location’s transformed future.
In an advisory meeting with a visual arts professor, we discussed that style itself communicates unspoken detail and intent. While the established solarpunk aesthetic is beautiful and inspiring, it is also utopian and unrealistic. This is why I veered to a more realistic direction. This was also informed by my thesis research and supported by some more loose testing.
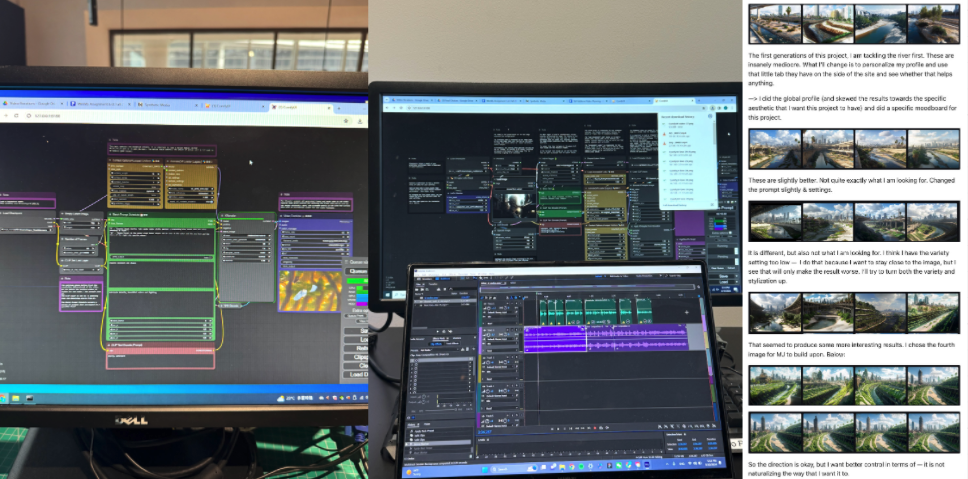
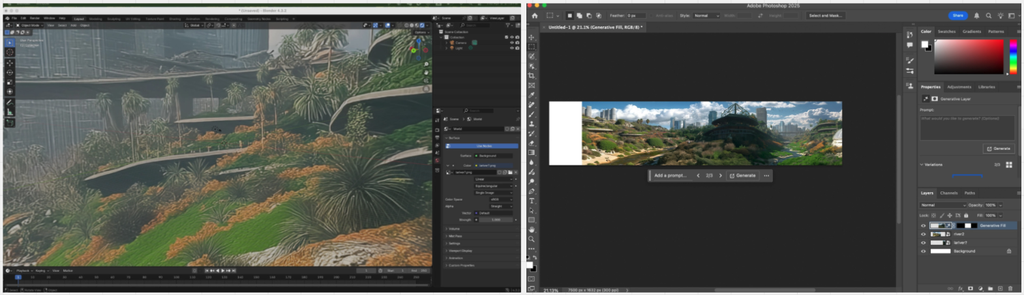
Moving forward with AI Generated visuals created by custom workflows to display the future visions of locations allowed for higher compatibility with technical decisions, and more efficiently conveyed complex ideas.
Mapping natural animations to mouse movement also added life and avoided static screens.
When I decided to use depth mapping* instead of skyboxes*, it meant I needed 2D images of the future visions. Instead of illustrating them myself, using my previous experience in synthetic media generation allowed my ideas to come to life while condensing the timeline significantly.
*Ask me more about the project’s technical decisions or see more on Github.
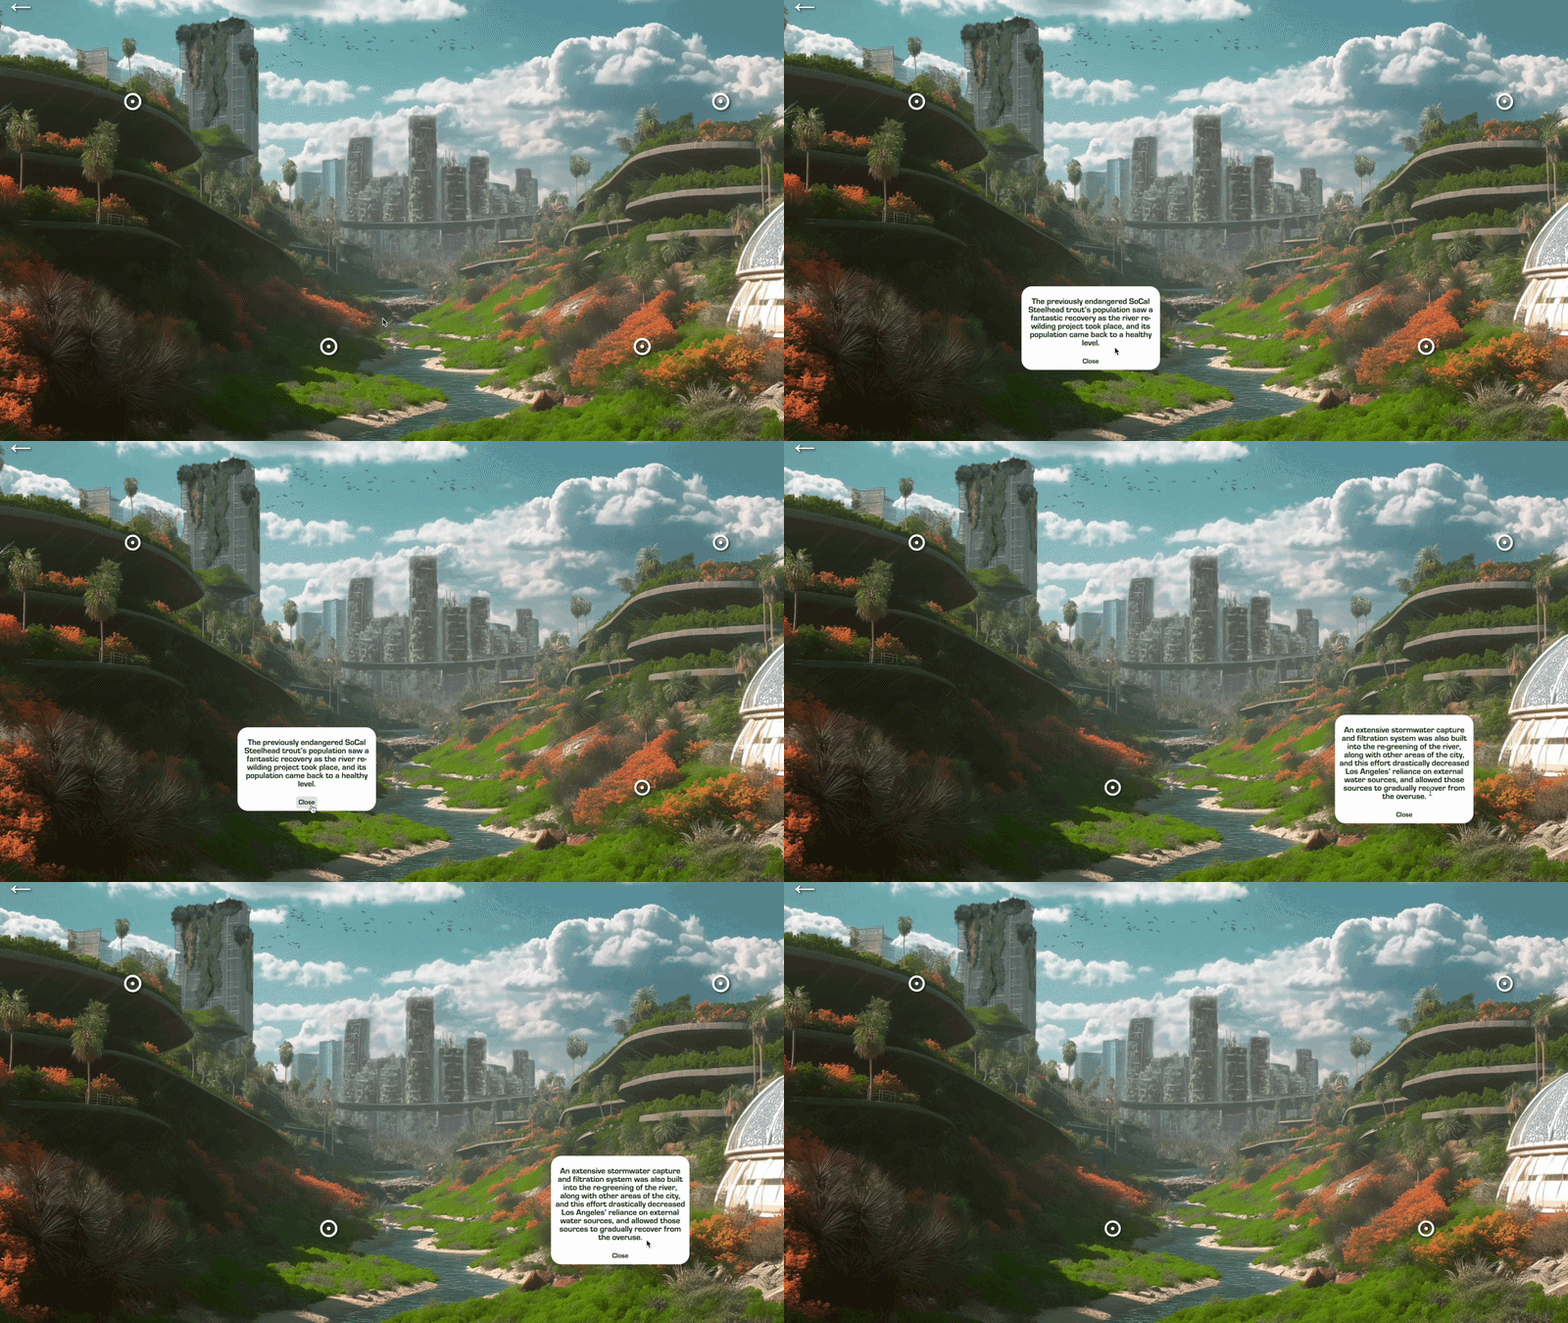
I used 2-4 clickable hotspots on each location to offer brief context on details of each transformation.
Each location was mapped to a distinct facet of solarpunk ideology, and featured specific technologies and concepts from my thesis research. However, in order to not burden users with paragraphs of explanation, I allowed the details to be self discoverable within the image.
I also included brief overarching narration before each stage for additional context.
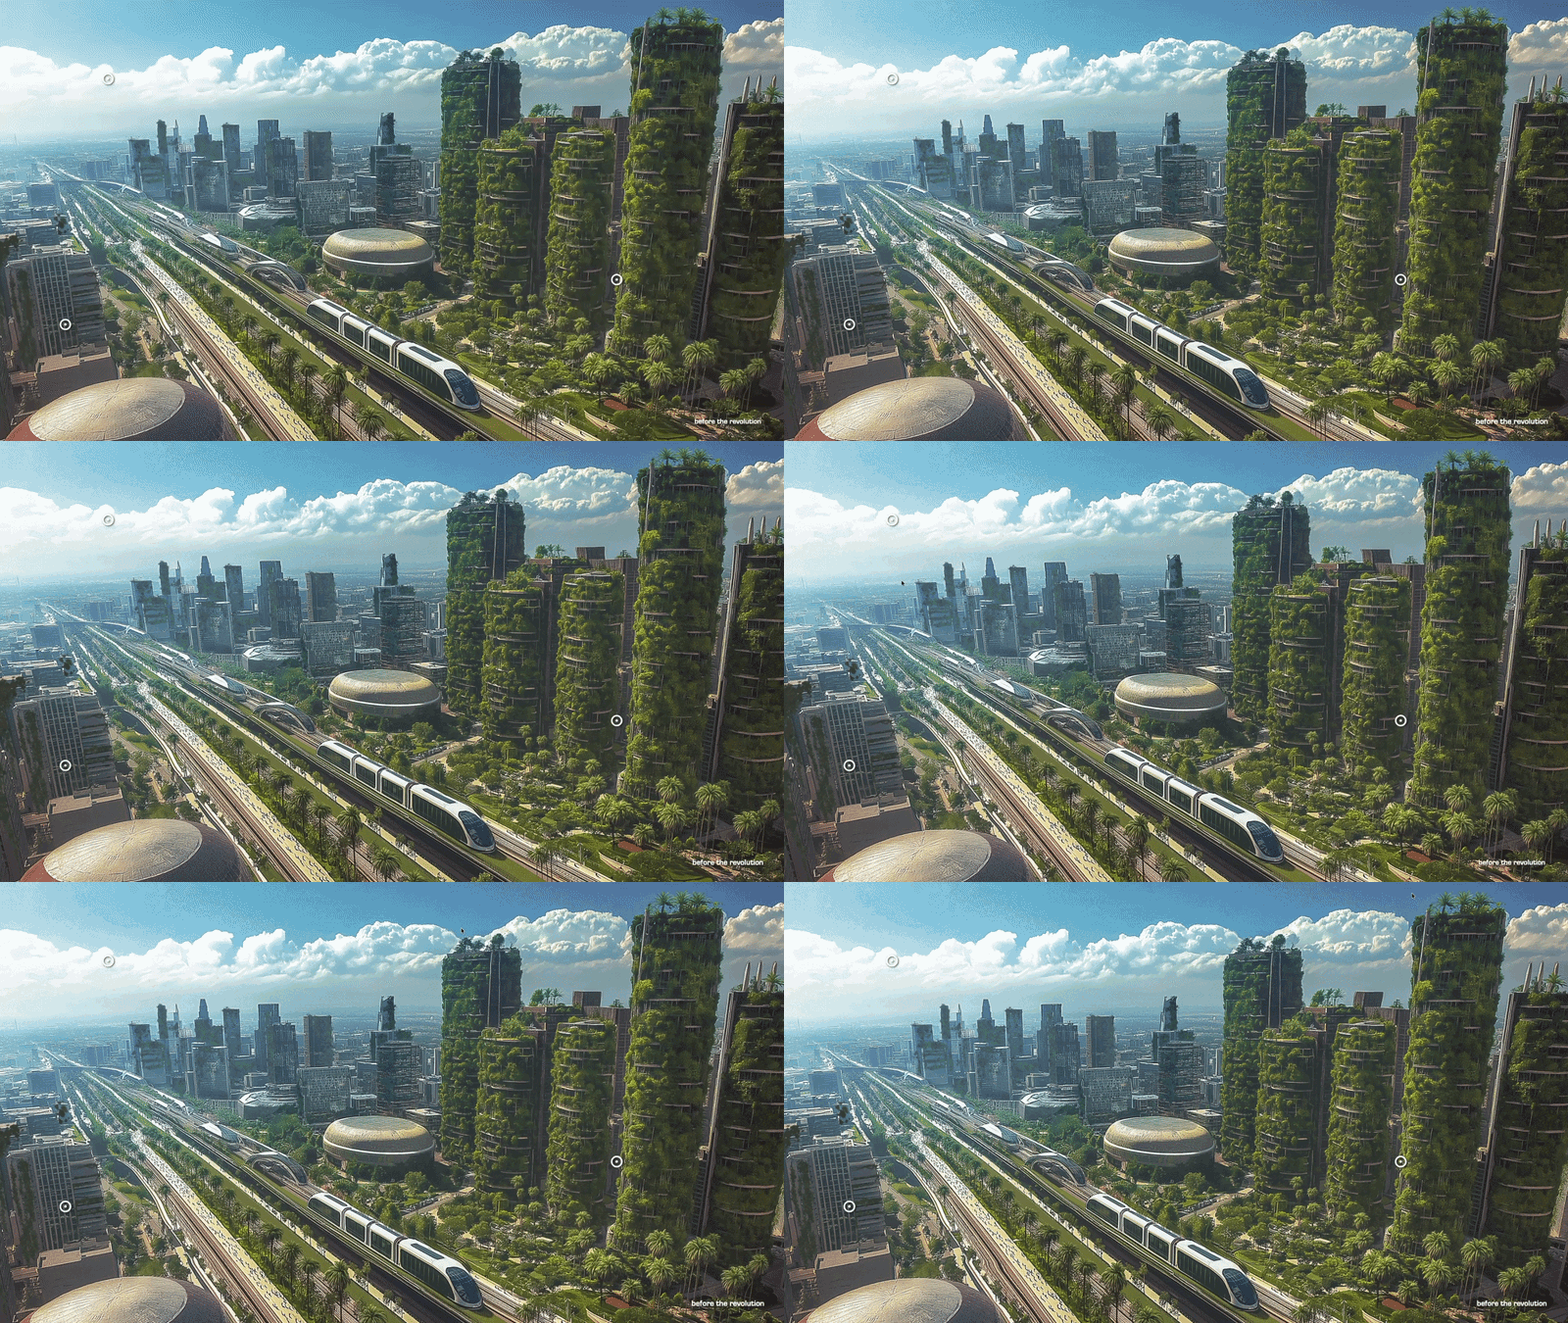
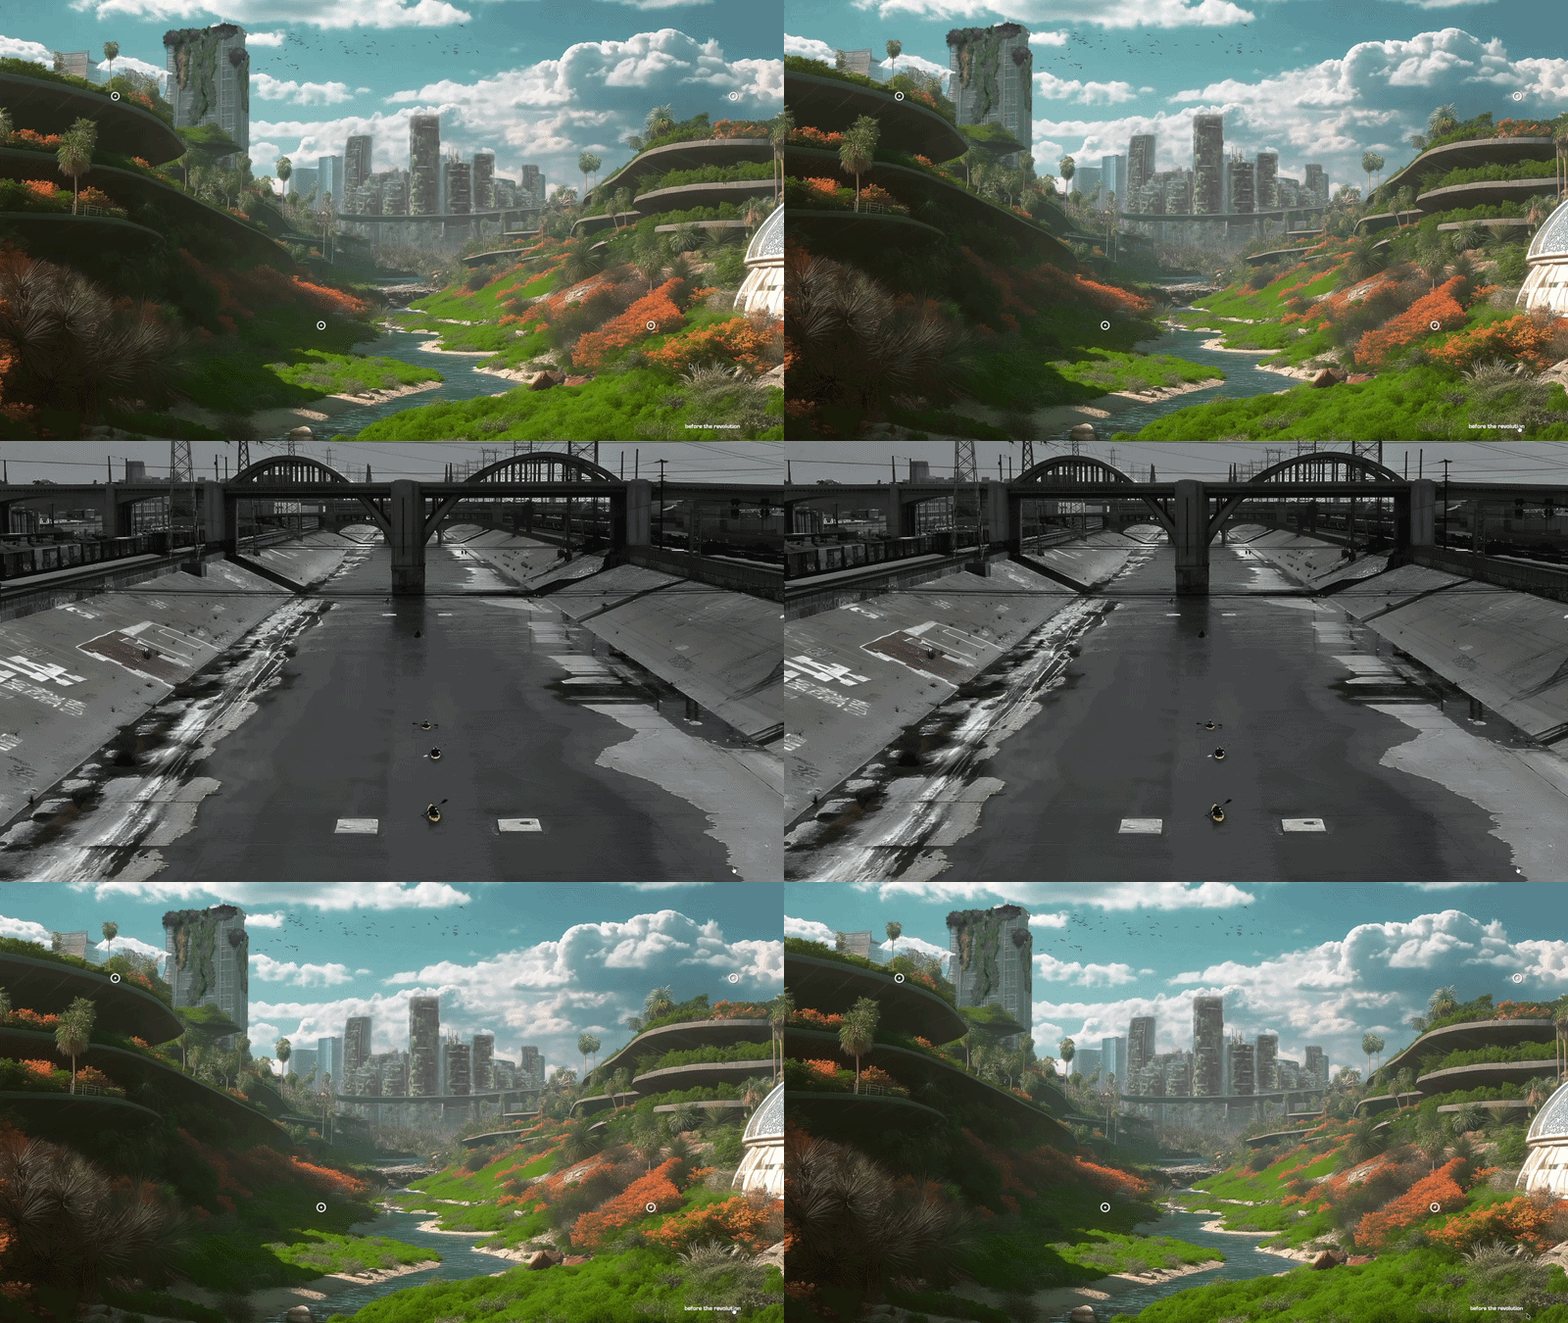
After an impactful A/B testing session, I added an additional feature within the map to allow users to also see the original image of the location (a before and after comparison).
I was initially not going to include this and was unsure whether or not it would be impactful. But there was an obvious consensus when testing:
★ 15 participants; 2 from LA and 13 international
★ All participants tested a version without a comparison button, and with one.
★ All 15 participants agreed that having the comparison increased the impact and message of the site. Several participants displayed feelings almost like discomfort.
★ “When I saw the solar version, I thought that’s what a river should look like – but seeing what it is in reality was so surprising, it doesn’t even look like a river at all.”
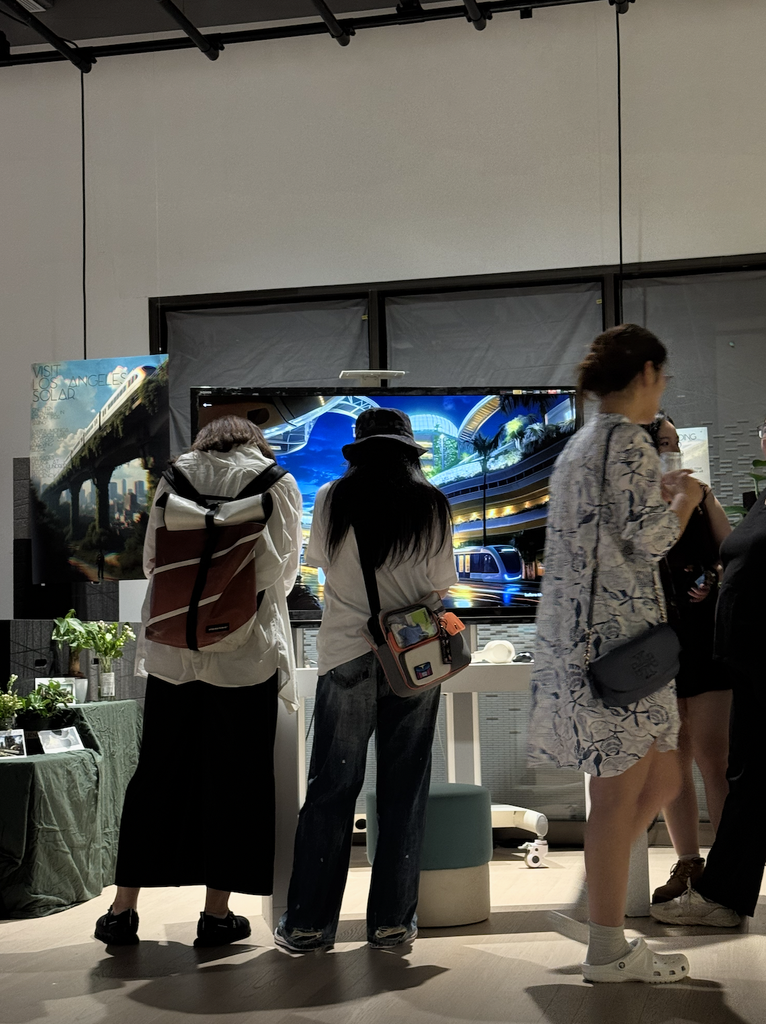
The finished project was displayed in a Capstone exhibit.
I was able to observe more than 50 people interact with my project in real time, gleaning some valuable insights to inform my future work and growth as a designer.
★ I observed at least 25% of users dropped at the map stage (before finishing the full interaction). This was different than in user testing where the full interaction was completed with all users.
★ Hypothesis as to why: The exhibit was more chaotic than testing, with a more rushed environment. There could have been many objective reasons as to why they did not finish, from my own button placements not being visible enough, to just simple disinterest. Regardless, it allowed me to see firsthand: a product is not for everyone, but investing time in your engaged audience is 100% worth it.
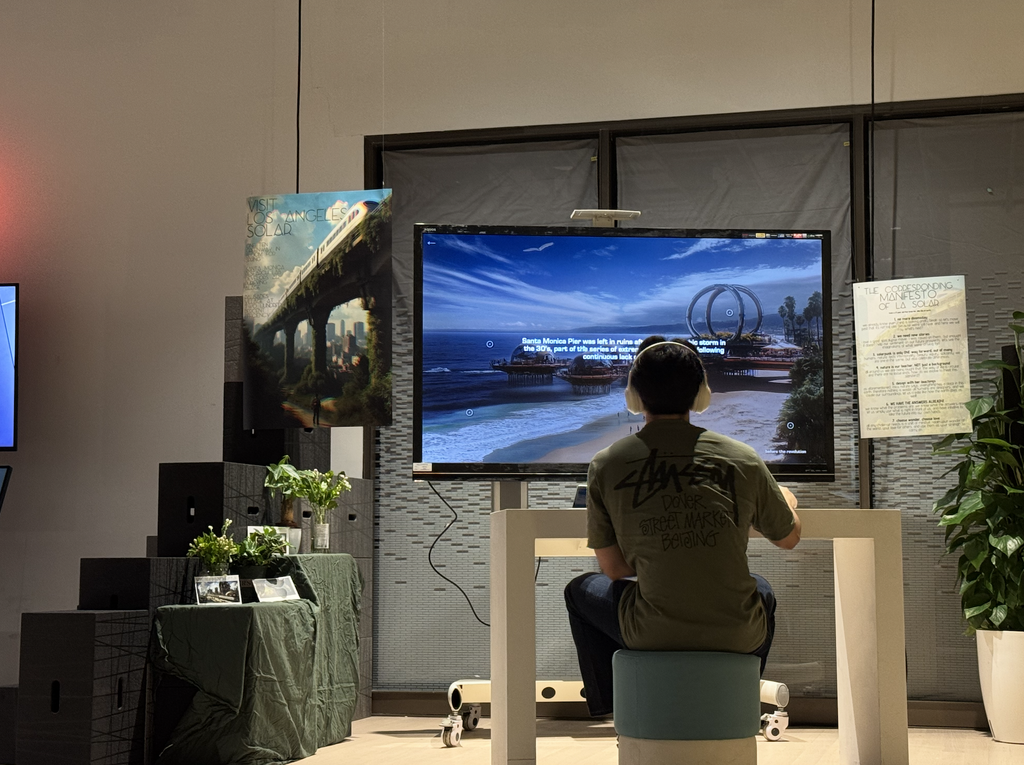
The results of the poll consistently hovered close to 50/50.
The goal of the poll was to provoke thought and create discussion; thus I considered it successful. Not everyone agreed it was possible, however they engaged in the critical thought, which was the intent.
What I would add/change
★ A back button on every stage of the story (instead of simply a restart button at the very end)
★ Additional instructions on how to interact with different stages of the site
★ A small description of the project on the title page
My own initial intentions got in the way of including these from the get go; I should have drafted the most clear experience from the start, and the considered whether there was more room for artistic intent or not.
★ More attention to typography and spacing
I knew from the start I would run out of time to refine smaller visual details, especially as I do not have formal training in CSS. But, I should have prioritized it in the schedule and planning, as typography and spacing are integral to a good UI.
Building Los Angeles Solar by myself, across research, visual design, and development, taught me how much resourcefulness it takes to build an idea and belief into something real people can experience. I am so greatful for this cross-functional experience and will take it with me to all future teams and work.
Thank you to my professors who guided me through this process and provided invaluable feedback along the way.
*Advised by Professors Andy Garcia and Yun Mi Her.
*Various LLMs were used during this project for debugging assistance.
next up …